Leo Abreu / Selected Work
Syngenta · Digital Agriculture
01 / Syngenta · Cropwise Sustainability
From farm practicesto decisions.
I led design across Cropwise Sustainability, helping growers assess their practices and making the resulting information easier to interpret across the app, partner reports and carbon tools.
Senior Product Designer
Jun 2024 – Dec 2025
Scope of work
Mobile
Assessments, onboarding and reports
Carbon
Crop- and field-level assessment workflows
Partner tools
Reporting dashboard and admin portal
02 / Project at a glance
One platform, different jobs to do.
People
Growers recording farm practices, supply-chain partners reviewing sustainability data, and country admins working across partner accounts.
My scope
I led the redesign across mobile, the partner dashboard, the admin portal and the Carbon Engine. My work included research, flow mapping, prototypes and UX QA.
Collaboration
I worked with product, engineering and business stakeholders to turn research and assessment rules into designs the team could build and review.
03 / The challenge
The data needed to stay useful after the form.
Cropwise Sustainability helps growers assess their practices against Syngenta’s Sustainable Outcomes in Agriculture standard. The assessment is only the beginning: people also need to understand which farm, crop and season a result represents and what it can tell them.
The service blueprint made the handoffs visible. Growers provide and review information; reports organize it for different audiences; carbon workflows depend on field and crop-cycle details. A choice that seemed small in one screen could change which data was used somewhere else.
Grower
Record the operation and its practices
Assessment and carbon
Review results at the right crop or field level
Partner or admin
Find the report for the right program and scope
Service blueprint / Summary of selected touchpoints, not a single linear flow.
01 / Discovery artifact
Finding unfinished work
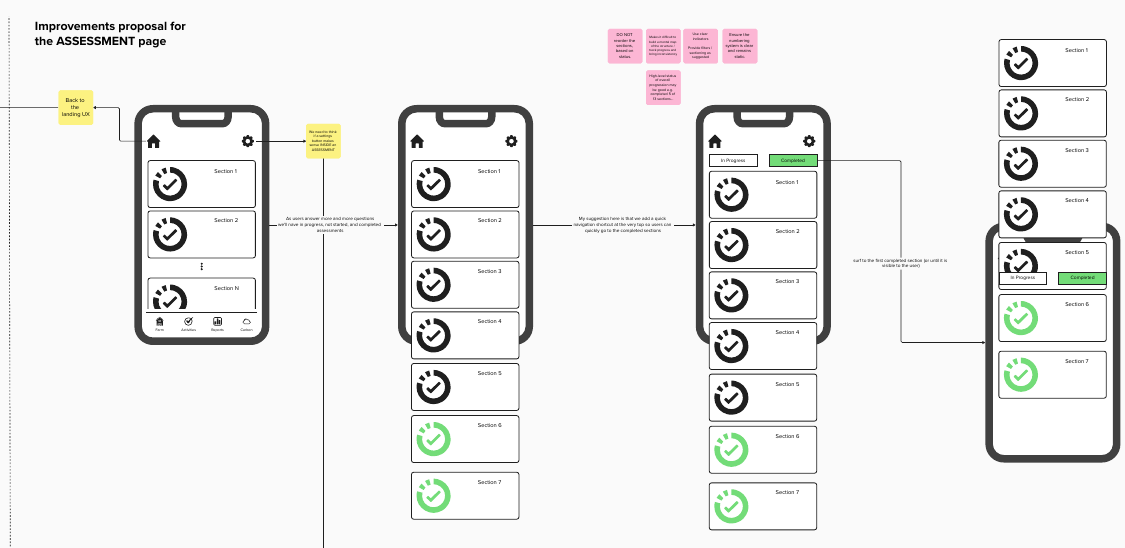
Original service blueprint excerpt / The team explored separating unfinished and completed sections so growers could find what still needed work.
04 / Key design decisions
Four decisions that kept the data in context.
01 / Mobile assessment
Make the next step clear without asking people to start over.
First-time growers needed to understand why they were answering the questions. Returning growers had a different problem: finding work in progress, reviewing completed assessments or updating information for another crop or year.
I worked on a shorter first-use introduction and an assessment list that separates in-progress and completed work. For repeat assessments, the flow explored reusing prior answers after a review, rather than asking growers to enter unchanged information again or assuming it was still accurate.
02 / Mobile assessment
From onboarding to review
01
Understand what’s ahead
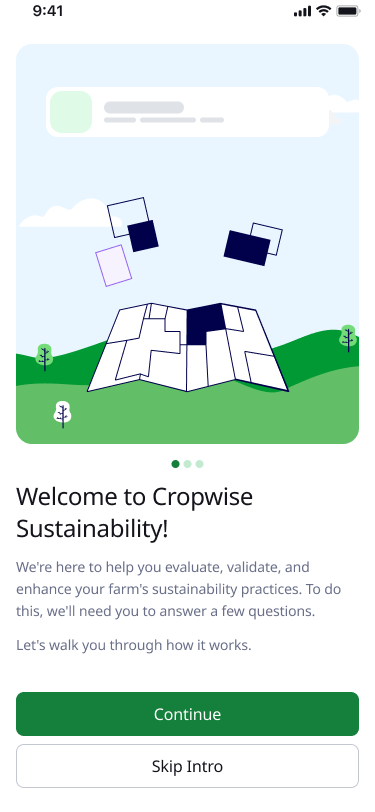
02
Pick up unfinished work
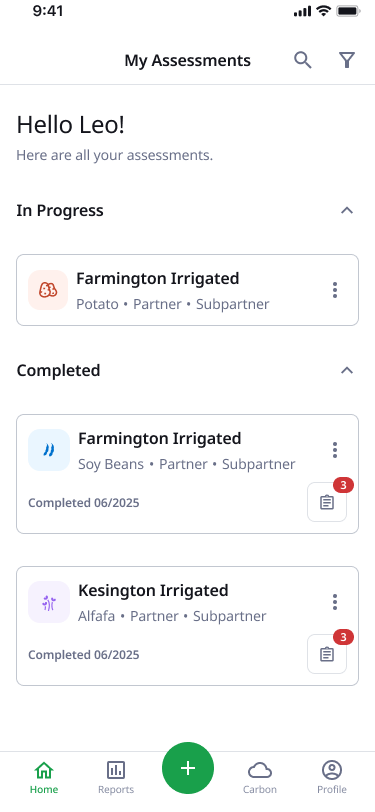
03
Review answers after submission
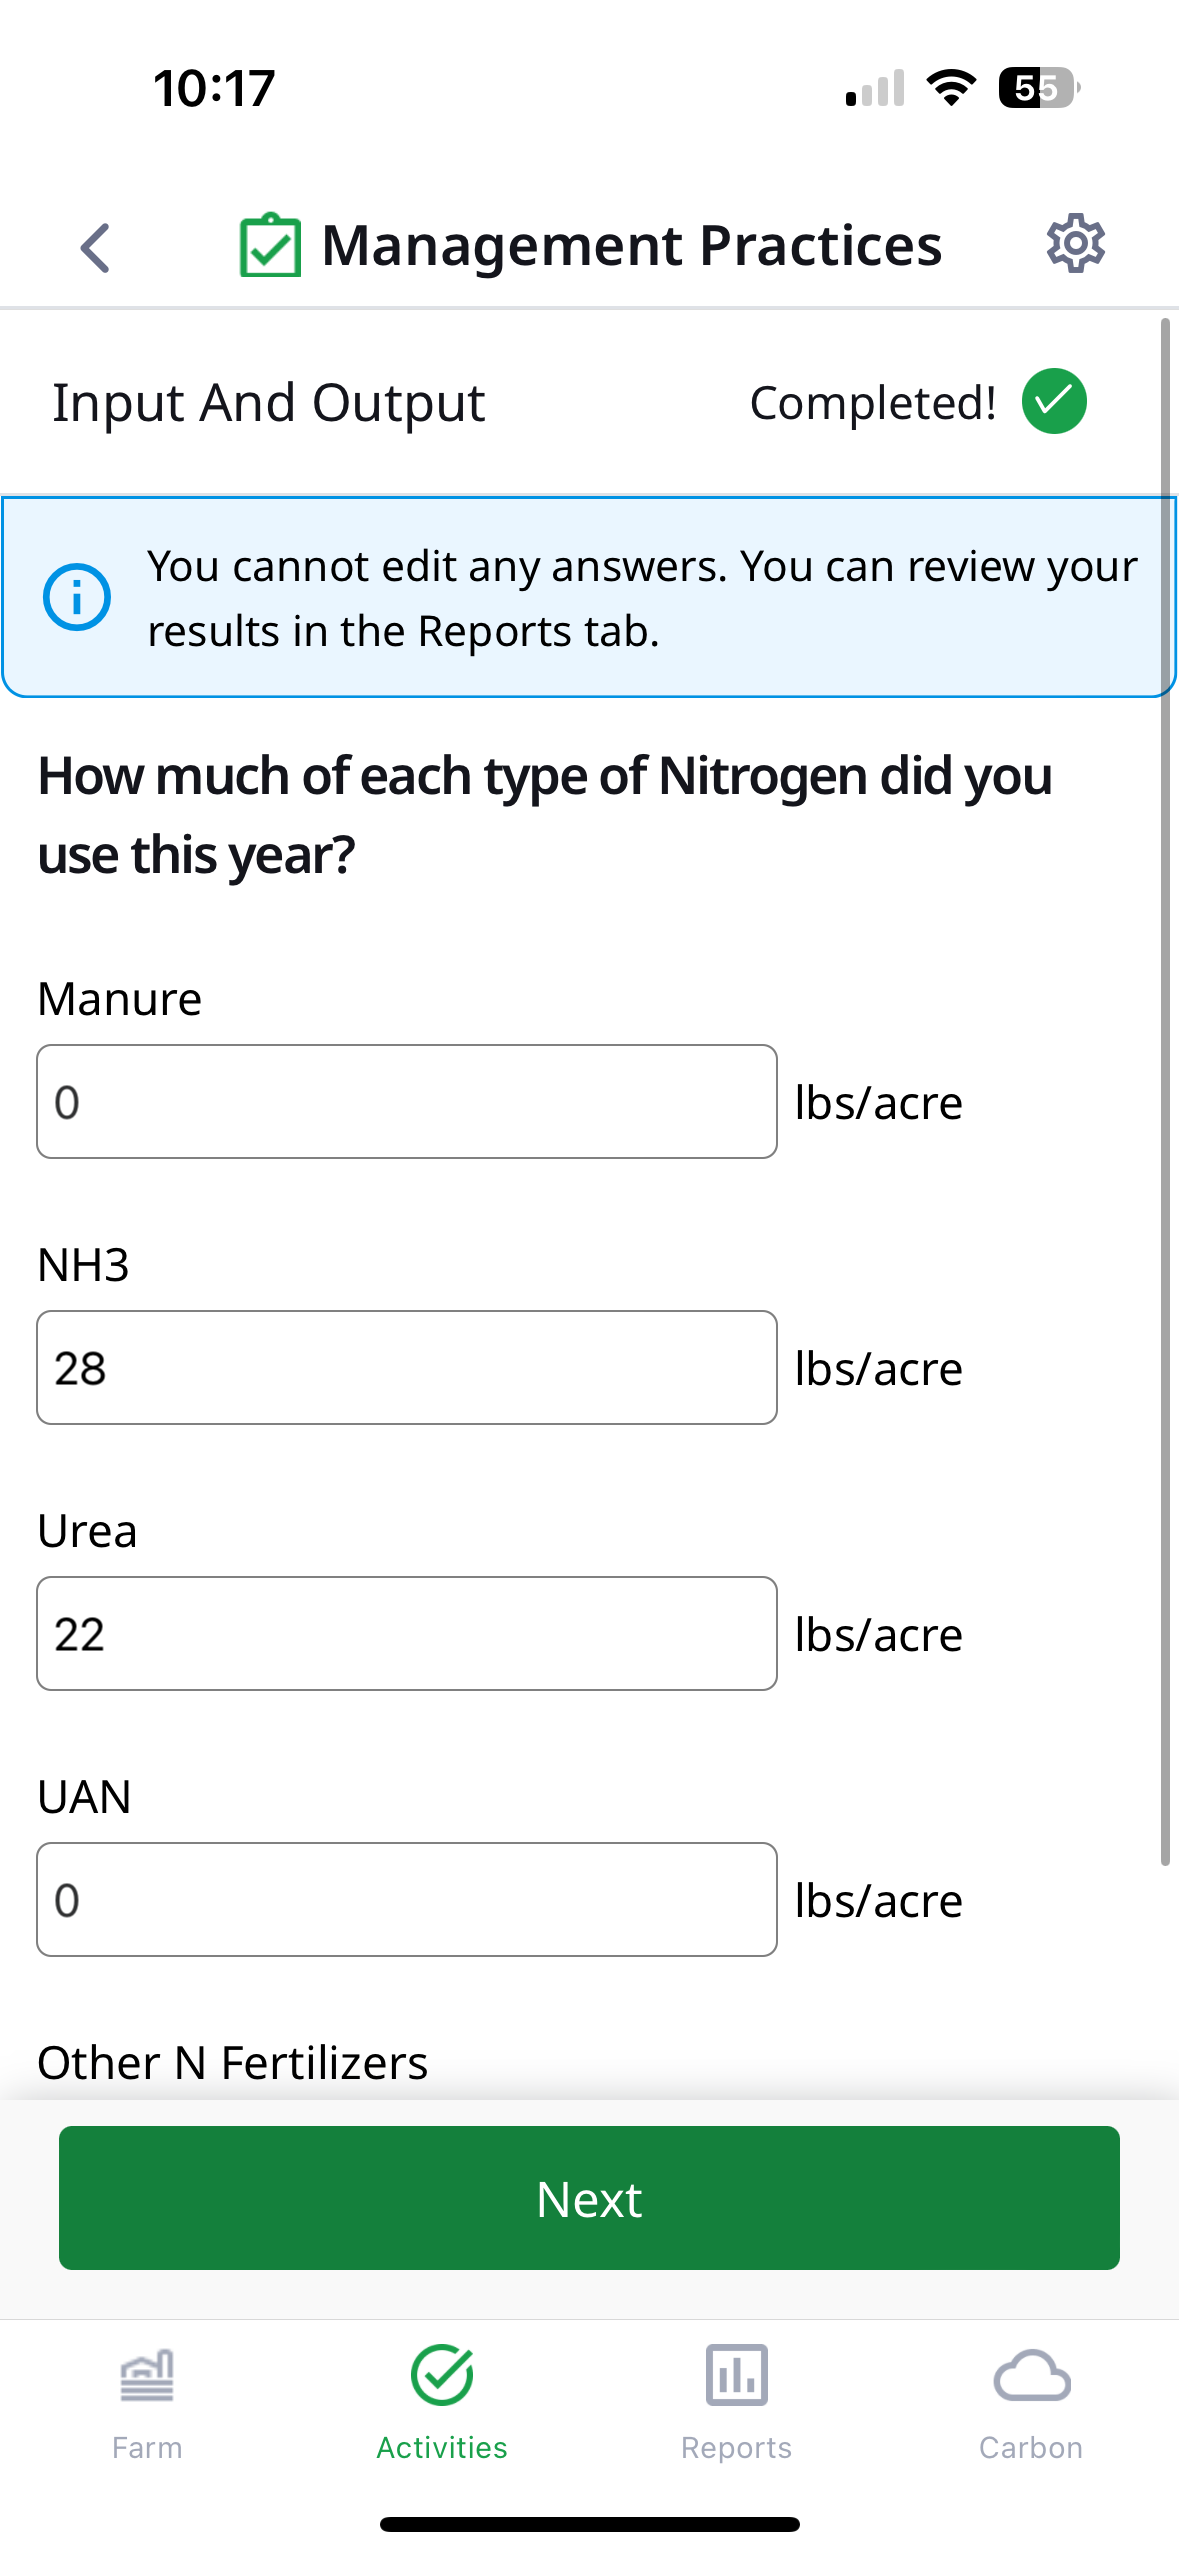
Cropwise design exports (01–02) and an archived product capture (03) / Selected states from the assessment journey.
03 / Flow exploration
Where should the next assessment begin?
Flow A
At submission
Submit assessment
→
Offer another assessment
→
Review and update prior details
Flow B
In Reports
Submit assessment
→
Review results in Reports
→
Start another assessment there
Redrawn from Mobile Flow Analysis, FigJam / Two alternatives explored, not a measured comparison.
Flow A / At submission
Offer another assessment immediately.
Useful if the grower already plans to record a different crop or partner; it also adds a decision at the end of a long task.
Flow B / In Reports
Let the grower review the result first.
Keeps completion focused; the option to create another assessment needs to be easy to find later.
Mobile Flow Analysis / Alternatives documented in FigJam, not a measured comparison.
02 / Results and report navigation
Show which assessment the result comes from.
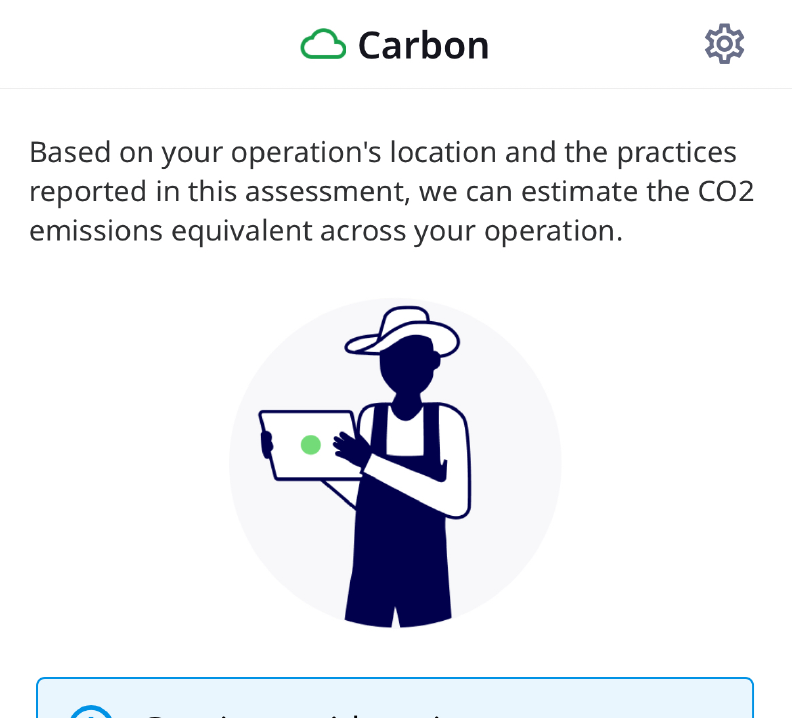
The reports-navigation board showed that one selection was doing several jobs: it affected the activities shown, the assessment copied into a new submission and the one sent to the carbon estimator. The carbon screen didn’t make its source assessment clear.
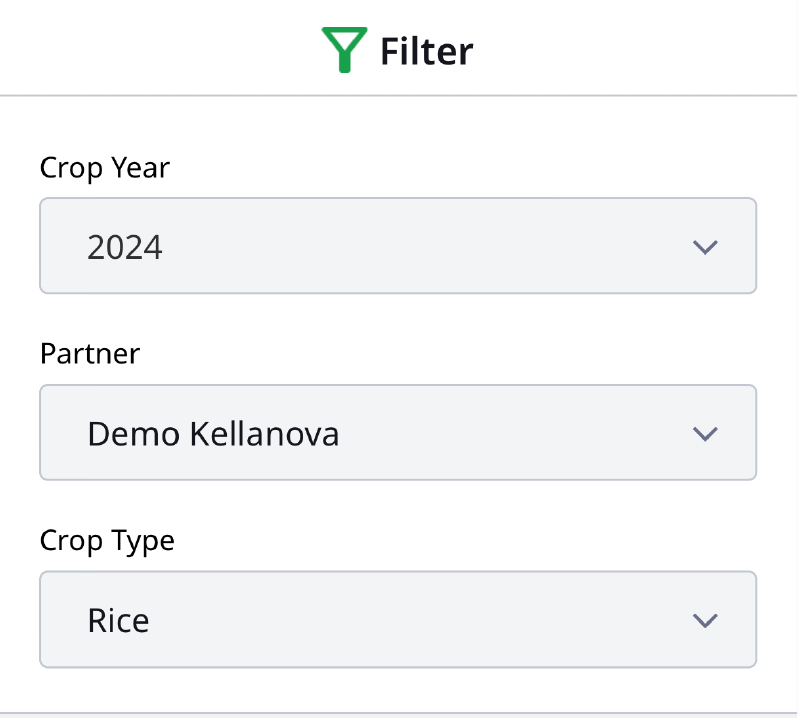
Research notes exposed a second ambiguity: a sustainability report could be mistaken for a full farm audit. The design response was to make the selected year, partner and crop visible at the point of use, and explain what a report or estimate covers rather than relying on the report title alone.
04 / Research + product audit
Where the assessment context disappears
01
Scope is explicit in Filters
02
Carbon refers to “this assessment”
Usability finding
The report’s name suggested more than it covered.
One research note recorded an expectation that the report covered all crops and audit areas. The note recommended explaining that its scope was sustainability only.
Paraphrased from the project’s usability-testing board.
Reports navigation audit / Original product captures with demo data. The report filter showed the inputs; the carbon entry did not repeat them.
Viewing results
Show the assessment context next to the report, not just inside a filter.
Reusing data
Identify what will be carried into the new assessment before copying it.
Estimating carbon
Make the input assessment visible so the result can be interpreted correctly.
Reports navigation and usability notes / Design implications from observed ambiguity.
03 / Carbon Engine
Reuse common data. Keep field-level exceptions.
The carbon workflow depends on more than selecting a farm. An organization can have many farms, a farm can have several fields, and a field can have more than one crop cycle. If no fields were mapped, the workflow needed to explain the dependency and point back to field setup.
The flow analysis flagged two issues: repeating entry across fields was tedious, and switching to per-field editing didn’t always make the change clear. I explored fast and custom paths, with the option to review or override field-specific information when inputs differed. The trade-off was less repeated work without flattening meaningful differences.
Identify the scope
Organization → farm → field → crop cycle
Reduce re-entry
Start with mapped or shared information when available
Review exceptions
Customize per field and show what still needs review
Carbon Flow Analysis and Carbon Module V2 / Synthesis of the workflow explored.
05 / CARBON ESTIMATE
What does the result actually describe?
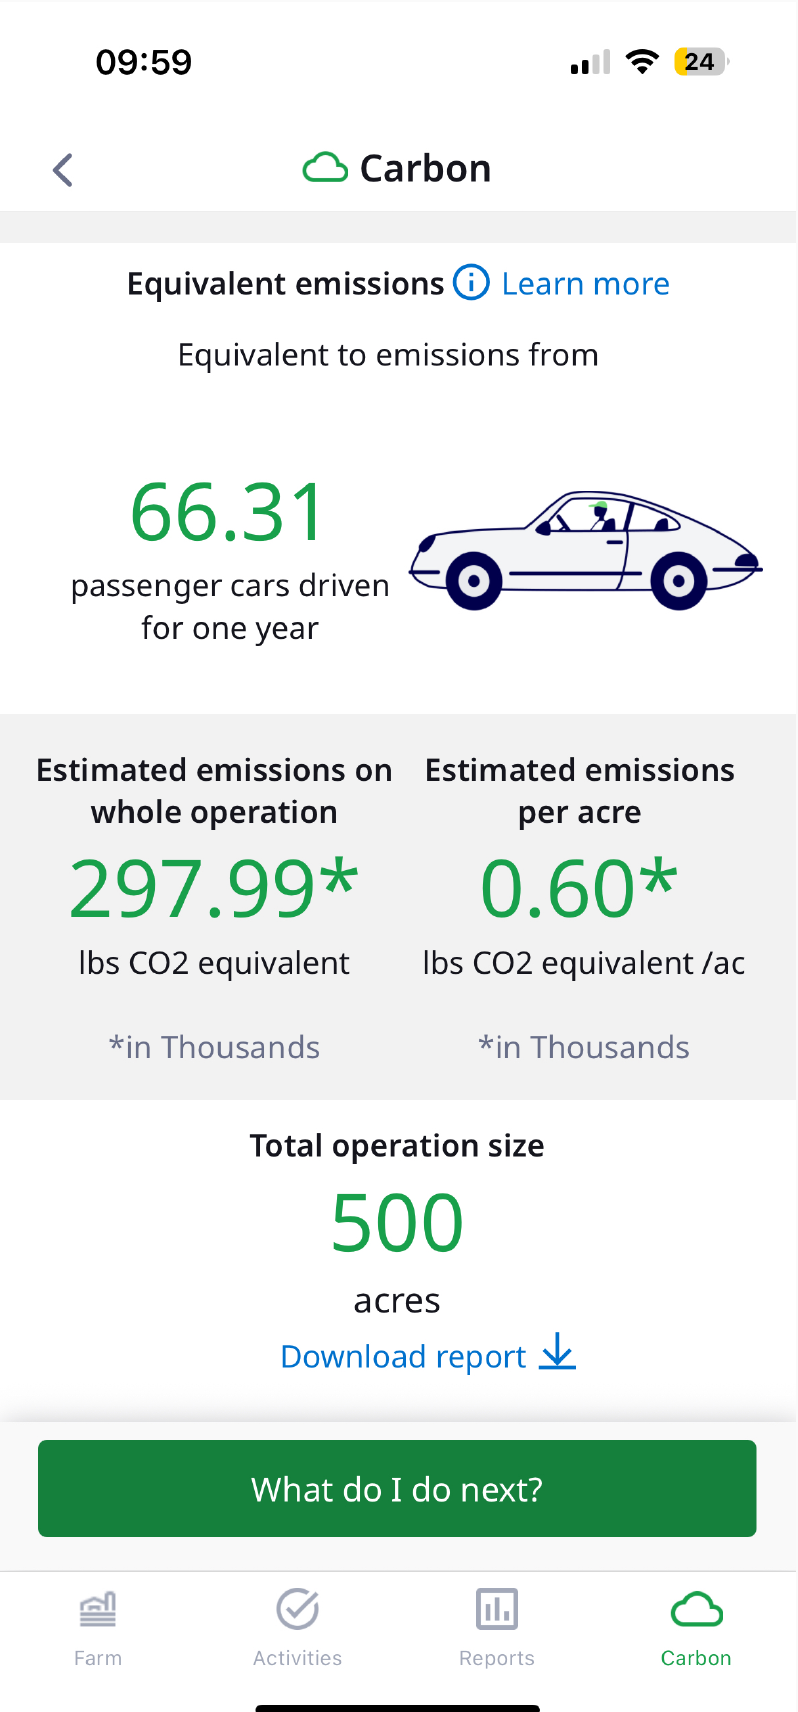
WHOLE OPERATION
The total estimate only makes sense when the grower knows which assessment and acreage it represents.
PER ACRE
The same estimate is shown per unit of area. Keeping the unit explicit helps people avoid reading it as a second total.
INPUTS MATTER
The desktop flow explored keeping field-level exceptions intact when collecting the practices that feed an estimate.
Archived mobile product capture / Demo assessment values, not a project outcome. This is the result screen, not the desktop field picker.
04 / Partner dashboard and admin
Make report scope and readiness visible.
Partners and country admins both needed reports, but their starting points differed. A partner should see the reports available in their scope. A country admin working across partners needs to know which partner’s information is currently selected.
The reporting blueprint also separated “not ready yet” from “ready to open.” I treated those as distinct states: show status while a report is pending; when it’s available, make it easy to find in the list and open its details. That avoids making an unavailable result look like missing data or a broken link.
06 / Reporting workflow
Two roles, one readiness decision
Entry
Scope by role
Partner: own reporting scope
Country admin: selected partner
Decision
Report ready?
Not yet: show report status
Ready: list reports and open details
Simplified from Partner Reports, FigJam / The report stays in the correct partner context throughout.
Partner view
Report status → available reports → details
Keep the user in their reporting scope and explain whether the report is ready.
Country admin view
Partner context → available reports → details
Carry the selected partner into the report view so the user can verify whose data they’re reviewing.
Partner reports FigJam / Simplified paths by role.
CROSS-SURFACE HANDOFF
Trace what the result represents before acting on it.
The assessment, carbon estimate and partner report are connected, but they are not interchangeable. The challenge was to carry enough context across those surfaces so people could verify whose information they were looking at, which inputs were used and whether a result was ready.
SITUATION
CONTEXT
DESIGN RESPONSE
Resume a grower assessment
An in-progress assessment needs a next step. A completed one needs a way to review what was submitted.
Separate the two in the list. Preserve enough context to resume or review without presenting a finished response as editable work.
Reuse answers for a new assessment
An earlier crop, year or partner can provide useful inputs, but they may not still apply.
Identify what will be copied and give the grower a chance to review it. Reuse should not silently imply that the underlying facts have stayed the same.
Read a carbon estimate
Whole-operation and per-acre values describe different units. They depend on the selected assessment and area.
Keep the input scope and unit legible with the output. In data entry, allow field-specific overrides when shared practice information does not apply everywhere.
Open a partner report
Partners stay within their scope; country admins may be working across several partners. A report can be pending.
Keep the partner context visible and distinguish a pending result from one ready to open. Do not make a normal delay look like a missing record.
I would validate the handoff rather than test these screens as isolated tasks: ask a grower which assessment fed an estimate, ask a partner whether a report is ready, and ask an admin whose report they just opened. Those tasks measure whether people can interpret the result. They would not, on their own, establish a change in agronomic or sustainability outcomes.
05 / Outcomes & business impact
Connected designs for assessment and reporting.
The work produced the second mobile app design, partner and admin workflows, and detailed Carbon Engine designs. I supported handoff and reviewed implementations for consistency before release. The case shows selected decisions and explored states, not a claim that every variation shipped.
Syngenta’s public partnership with the Potato Sustainability Alliance illustrates why the reporting job mattered beyond the app. It is product context, not a measured outcome of this redesign.
06 / What I learned
The context belongs with the number.
A sustainability score or estimate is only useful if people can tell what it describes. I’d validate the handoffs directly: can a grower resume without re-entering data, can they identify which assessment feeds the estimate, and can a partner tell whether a report is pending or ready?